Security | Threat Detection | Cyberattacks | DevSecOps | Compliance

Dashboards

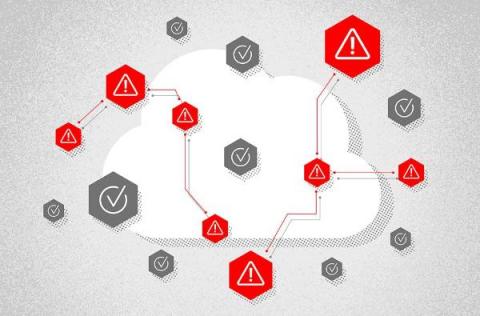
3 Ways Visualization Improves Cloud Asset Management and Security

Public cloud services and cloud assets are agile and dynamic environments. Close oversight of these assets is a critical component of your asset management and security practices. While it’s important to understand the relationships and potential vulnerabilities of your cloud assets, the practice of managing these systems is complicated by the ever-changing nature of cloud environments.

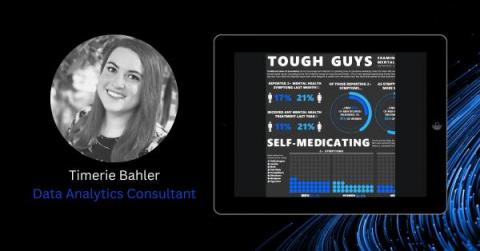
"A data viz expert is like a language translator."

Timerie Bahler is no stranger to digging deep into the data of organizations – from telecommunications to trucking and finance companies. Many different industries, with many different challenges. What they all have in common is that somewhere in the data there’s always something new to discover that has the power to enhance operations and bottom lines. And that keeps Timerie motivated, professionally, as she turns ostensibly hidden information into actionable insight.

How to Deploy the Kubernetes Dashboard

Kubernetes clusters consist of multiple resources and API objects interacting dynamically—which typically makes cluster management via the CLI overwhelming. Kubernetes Dashboard was built to simplify cluster operations by providing a unified, human-friendly interface. The web-based dashboard enables cluster operators to deploy applications, access running workloads, and correlate logs with cluster events. This article demonstrates how to install and use Kubernetes Dashboard.

Table Calculations

Use table calculations to roll up Total/Percentages into a single value for summary visualizations. Netskope, the SASE leader, safely and quickly connects users directly to the internet, any application, and their infrastructure from any device, on or off the network. With CASB, SWG, and ZTNA built natively in a single platform, Netskope is fast everywhere, data-centric, and cloud smart, all while enabling good digital citizenship and providing a lower total-cost-of-ownership.

Charts - GeoMaps

Netskope Advanced Analytics: Learn how to build and customize GeoMaps. Netskope, the SASE leader, safely and quickly connects users directly to the internet, any application, and their infrastructure from any device, on or off the network. With CASB, SWG, and ZTNA built natively in a single platform, Netskope is fast everywhere, data-centric, and cloud smart, all while enabling good digital citizenship and providing a lower total-cost-of-ownership.

Overview of Popular Dashboards

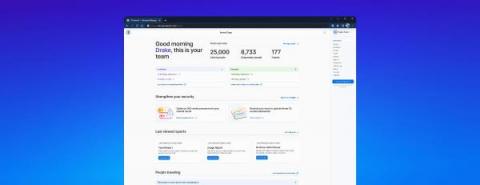
Use pre-built dashboards as a starting point to visualize risk. Netskope, the SASE leader, safely and quickly connects users directly to the internet, any application, and their infrastructure from any device, on or off the network. With CASB, SWG, and ZTNA built natively in a single platform, Netskope is fast everywhere, data-centric, and cloud smart, all while enabling good digital citizenship and providing a lower total-cost-of-ownership.